Introduction
Presenting research findings clearly is an essential part of dissertation writing. After completing data collection and analysis, researchers must organise their results in a way that helps readers understand the evidence, recognise important patterns and evaluate how the findings address the research questions. Effective data presentation is not simply about displaying numbers or summarising interview responses; it involves selecting appropriate formats and explaining what the results mean within the context of the study.
Knowing how to present data in dissertation is particularly important for PhD scholars and postgraduate students working with quantitative, qualitative or mixed-methods research. Different forms of data require different presentation techniques, and the choice of method should reflect the research objectives, analytical approach and nature of the findings.
This guide explores the main methods of presenting data, the use of tables and visualisations, and practical dissertation data presentation guidelines to help researchers communicate their findings accurately and effectively.
Why Is Data Presentation Important in a Dissertation?
Data presentation connects the research methodology with the interpretation of findings. Even when a study uses appropriate data collection and analytical procedures, poorly organised results can make its contribution difficult to understand.
A clear presentation enables readers to identify key findings, compare results and understand relationships between variables or themes. In quantitative research, this may involve presenting statistical results through tables, charts and graphs. In qualitative research, findings may be communicated through themes, participant quotations and structured explanations.
Effective presentation also supports transparency. Readers should be able to understand how the findings relate to the research questions and distinguish the evidence obtained from the researcher’s interpretation. Therefore, data presentation should be accurate, logically organised and consistent with the methodology described earlier in the dissertation.
How to Present Data in Dissertation
The most suitable way to present data depends on the research questions, the type of information collected and the methods used for analysis. Before preparing tables or figures, researchers should decide which findings are essential to answering the research questions.
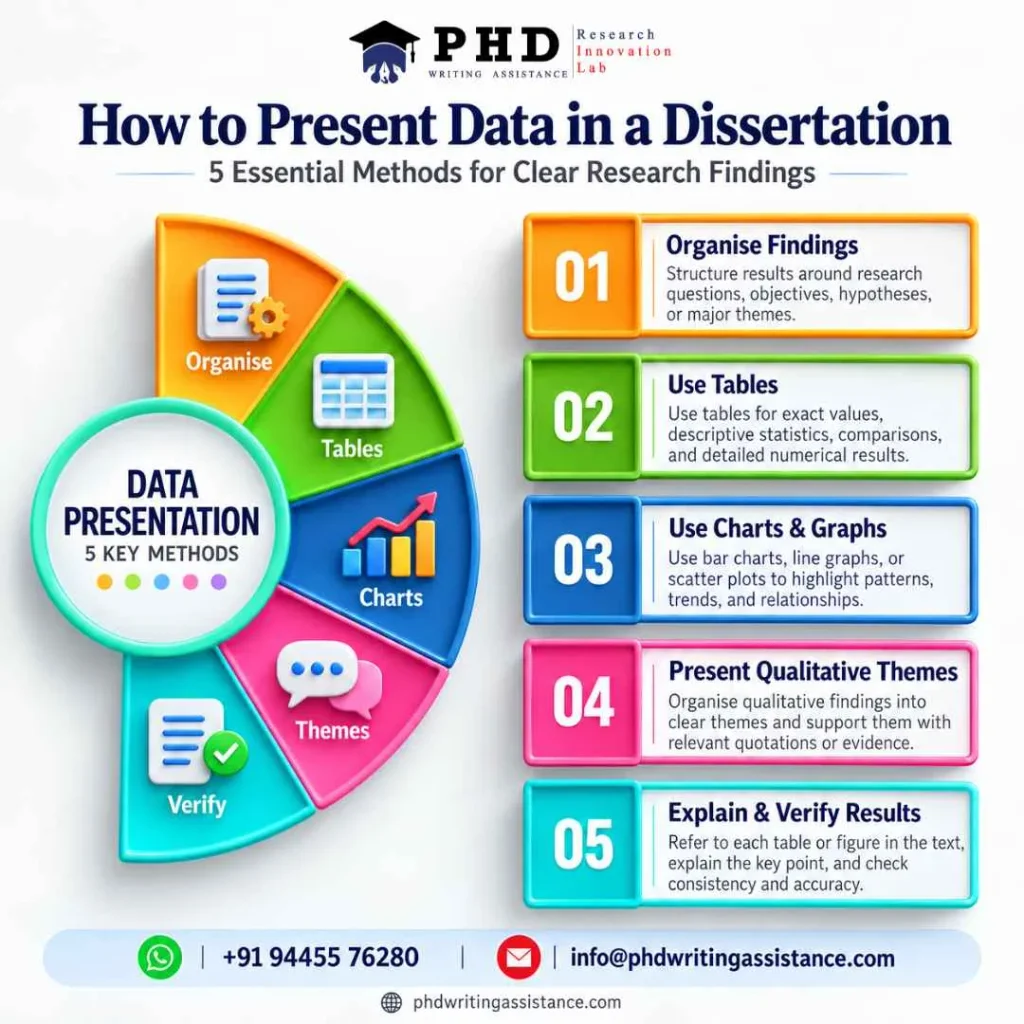
Start by organising the results according to the dissertation objectives, hypotheses or major research themes. This creates a logical structure and prevents the results chapter from becoming a collection of unrelated outputs.
Next, select a presentation format that makes the evidence easy to understand. Numerical results may be summarised in tables or visualised through charts, while qualitative findings may be organised around themes supported by relevant participant quotations. Mixed-methods studies may combine numerical summaries with qualitative explanations to demonstrate how different forms of evidence complement one another.
Each table, figure or thematic section should have a clear purpose. Introduce the information, present the relevant evidence and explain the most important observations. Avoid repeating every value from a table in the accompanying text. Instead, draw attention to the patterns, comparisons or findings that matter most to the research questions.
Methods of Presenting Data in Research
Several methods can be used to present research data. The appropriate choice depends on the study design, the data collected and the intended message.
Tabular Data Presentation
Tables organise information into rows and columns, making them useful for displaying precise values, descriptive statistics, comparisons and detailed results. Researchers may use tables to summarise participant characteristics, survey responses, statistical tests or comparisons between groups.
A good table should have a descriptive title, clearly labelled rows and columns, appropriate units and consistent formatting. Abbreviations should be explained where necessary, and sources should be acknowledged when external information is included.
Tables are particularly useful when readers need to examine several values accurately. However, large tables containing excessive detail can interrupt the flow of the dissertation. Researchers should include only relevant information in the main chapter and consider placing supplementary results in an appendix when appropriate.
Graphs and Charts
Graphs and charts help readers recognise patterns and relationships that may be difficult to identify in lengthy numerical summaries. Bar charts can compare categories, line graphs can illustrate changes over time, and scatter plots can help display relationships between two numerical variables.
Researchers should select a chart based on the type of data and the intended comparison. For example, a line graph may be suitable for tracking changes across several time points, while a bar chart may be more appropriate for comparing distinct groups.
Visual clarity is important. Use readable labels, appropriate scales and consistent formatting. Avoid decorative effects that distract from the evidence, and ensure that the graph does not exaggerate differences or imply relationships unsupported by the analysis.
Narrative Data Presentation
Narrative presentation explains research findings through structured written descriptions. It is useful when the results require context, when only a small number of findings need to be reported or when the relationship between observations is more important than a numerical summary.
Narrative explanations should remain closely connected to the evidence. Researchers should identify the main findings, provide relevant details and avoid introducing unsupported interpretations. Where numerical results are presented in the text, report the values accurately and explain their relevance to the research question.
Thematic Data Presentation
Thematic presentation is commonly used in qualitative research, particularly when data are collected through interviews, focus groups, observations or open-ended responses. Researchers organise the findings around themes or patterns identified during analysis.
Each theme should be clearly defined and supported by appropriate evidence, such as participant quotations or observation extracts. Quotations should illustrate the theme rather than replace the researcher’s analysis. Researchers should explain what the evidence demonstrates and consider similarities, differences and exceptions within the data.
Themes should emerge from a systematic analytical process rather than being selected simply because they support the researcher’s expectations.
Presenting Quantitative Research Data
Quantitative research involves numerical information that can be analysed using descriptive or inferential statistical methods. Presenting quantitative data requires accuracy, consistency and a clear explanation of the results.
Descriptive statistics, including frequencies, percentages, means and standard deviations, can summarise the characteristics of a sample or the distribution of responses. Depending on the research design, inferential statistics may be used to examine differences, associations or relationships between variables.
Researchers should report the statistics relevant to their research questions and explain what the results indicate. Where applicable, this may include sample sizes, confidence intervals, effect sizes, test statistics and p-values. The precise reporting requirements depend on the statistical method and the discipline.
Importantly, statistical significance should not be treated as proof that a finding is practically important or that one variable causes another. Interpretation should reflect the study design, assumptions and limitations. Any tables or figures should agree with the values reported in the text.
Presenting Qualitative Research Data
Qualitative research focuses on meaning, experiences, perspectives and social processes. Presenting qualitative data requires researchers to communicate the depth of the evidence while showing how the findings were developed from the analysis.
Organising the results into themes, categories or analytical concepts can help readers follow the argument. Each section should explain the theme, describe the relevant pattern and include carefully selected evidence from participants or other data sources.
Participant quotations should be presented accurately and anonymised where necessary. Researchers should explain the context of quotations and avoid selecting only statements that confirm their initial assumptions. Contrasting experiences or unexpected findings may provide important insights into the research question.
The presentation should also reflect the qualitative approach used. For example, thematic analysis, grounded theory and narrative research may organise and interpret evidence differently. Researchers should follow the analytical principles appropriate to their chosen methodology rather than applying a generic structure to every qualitative study.
Research Data Visualisation: Tables, Charts and Graphs
Research data visualisation involves communicating information through visual formats that make patterns, comparisons and relationships easier to understand. When used appropriately, visualisation can improve the readability of a dissertation and help readers identify important results quickly.
The choice of visual format should follow the purpose of the analysis. Bar charts are useful for category comparisons, line graphs for trends over time, and scatter plots for examining relationships between numerical variables. Tables are often preferable when readers need exact values or detailed statistical information.
Visualisations must represent the data honestly. Researchers should use appropriate scales, label axes clearly and provide informative captions. Where uncertainty or variation is important, it should be represented using suitable measures rather than hidden through simplified displays.
Every figure should be referenced in the text and followed by an explanation of its relevance. Visuals should support the argument, not serve as a substitute for analysis.
Dissertation Data Presentation Guidelines
Following consistent dissertation data presentation guidelines improves readability and helps maintain academic quality throughout the results chapter.
First, follow the formatting requirements provided by the university or department. These may specify the placement of tables and figures, caption styles, numbering conventions, referencing formats and appendix requirements.
Second, number tables and figures consistently and refer to them in the text. Each should have a descriptive title or caption that enables readers to understand its purpose. Include units, legends and explanations of abbreviations where required.
Third, maintain consistency in terminology, decimal places, statistical notation and visual design. Check that the information displayed matches the original analysis and that all sources are acknowledged.
Finally, distinguish the presentation of findings from their broader interpretation. In many dissertations, the results chapter reports the evidence, while the discussion chapter relates the findings to existing literature, theory and research implications. However, the exact structure depends on the university’s requirements and the research design.
Common Data Presentation Mistakes to Avoid
One common mistake is including too much information without explaining its relevance. Large volumes of statistical output, repeated tables and unnecessary figures can make the results chapter difficult to follow. Researchers should prioritise findings that address the research objectives.
Another problem is choosing a visual format that does not suit the data. For example, a complex chart may obscure a simple comparison that would be clearer in a table. Inconsistent labels, misleading scales and missing captions can also reduce the reliability of the presentation.
Researchers should avoid interpreting results beyond what the evidence supports. Correlation does not automatically establish causation, and qualitative findings should not be presented as representative of an entire population without appropriate justification.
A final mistake is failing to check consistency between the results chapter, tables, figures and discussion. Careful proofreading and verification can help identify discrepancies before submission.
Research Data Presentation and Dissertation Support
Preparing a clear results chapter requires both analytical understanding and effective academic communication. Researchers may need to organise complex findings, select appropriate visualisation techniques, explain statistical outputs or present qualitative themes in a coherent structure.
PhD Research Assistance and Research Methodology Assistance can support researchers in understanding analytical approaches and organising their findings. Academic editing and proofreading can also help improve clarity, consistency, formatting and the overall presentation of a dissertation.
The most effective support should strengthen the researcher’s own understanding and interpretation of the evidence. Researchers remain responsible for ensuring that the findings are accurate, conclusions are justified and the final dissertation complies with their institution’s academic integrity requirements.
Conclusion
Learning how to present data in dissertation involves selecting appropriate methods, organising findings logically and explaining the evidence clearly. Tables, charts, graphs, narrative descriptions and thematic analysis each serve different purposes, and the choice should reflect the research design and research questions.
Strong data presentation is accurate, consistent and transparent. By following dissertation data presentation guidelines, using research data visualisation appropriately and avoiding unsupported interpretations, researchers can make their findings easier to understand and evaluate. Ultimately, effective presentation helps readers recognise the significance of the research while preserving the integrity of the evidence.
Frequently Asked Questions
1. How do you present data in dissertation?
Organise findings according to the research questions or objectives, select suitable tables, charts, graphs or thematic descriptions, and explain the main results clearly. Follow your university’s formatting guidelines and ensure that every result is accurate.
2. What are the main methods of presenting data in research?
Common methods include tables, charts, graphs, narrative descriptions and thematic presentation. The appropriate method depends on whether the research uses quantitative, qualitative or mixed-methods data.
3. How should qualitative data be presented in a dissertation?
Qualitative data can be organised into themes or categories and supported with relevant participant quotations or observation extracts. Explain what the evidence demonstrates and include contrasting findings where relevant.
4. What is research data visualisation?
Research data visualisation is the use of charts, graphs and other visual formats to communicate patterns, comparisons and relationships in research findings. The chosen format should represent the data accurately and clearly.
5. What are the main dissertation data presentation guidelines?
Follow your university’s formatting requirements, number and label tables and figures consistently, explain abbreviations, verify all reported values and ensure that interpretations are supported by the evidence.